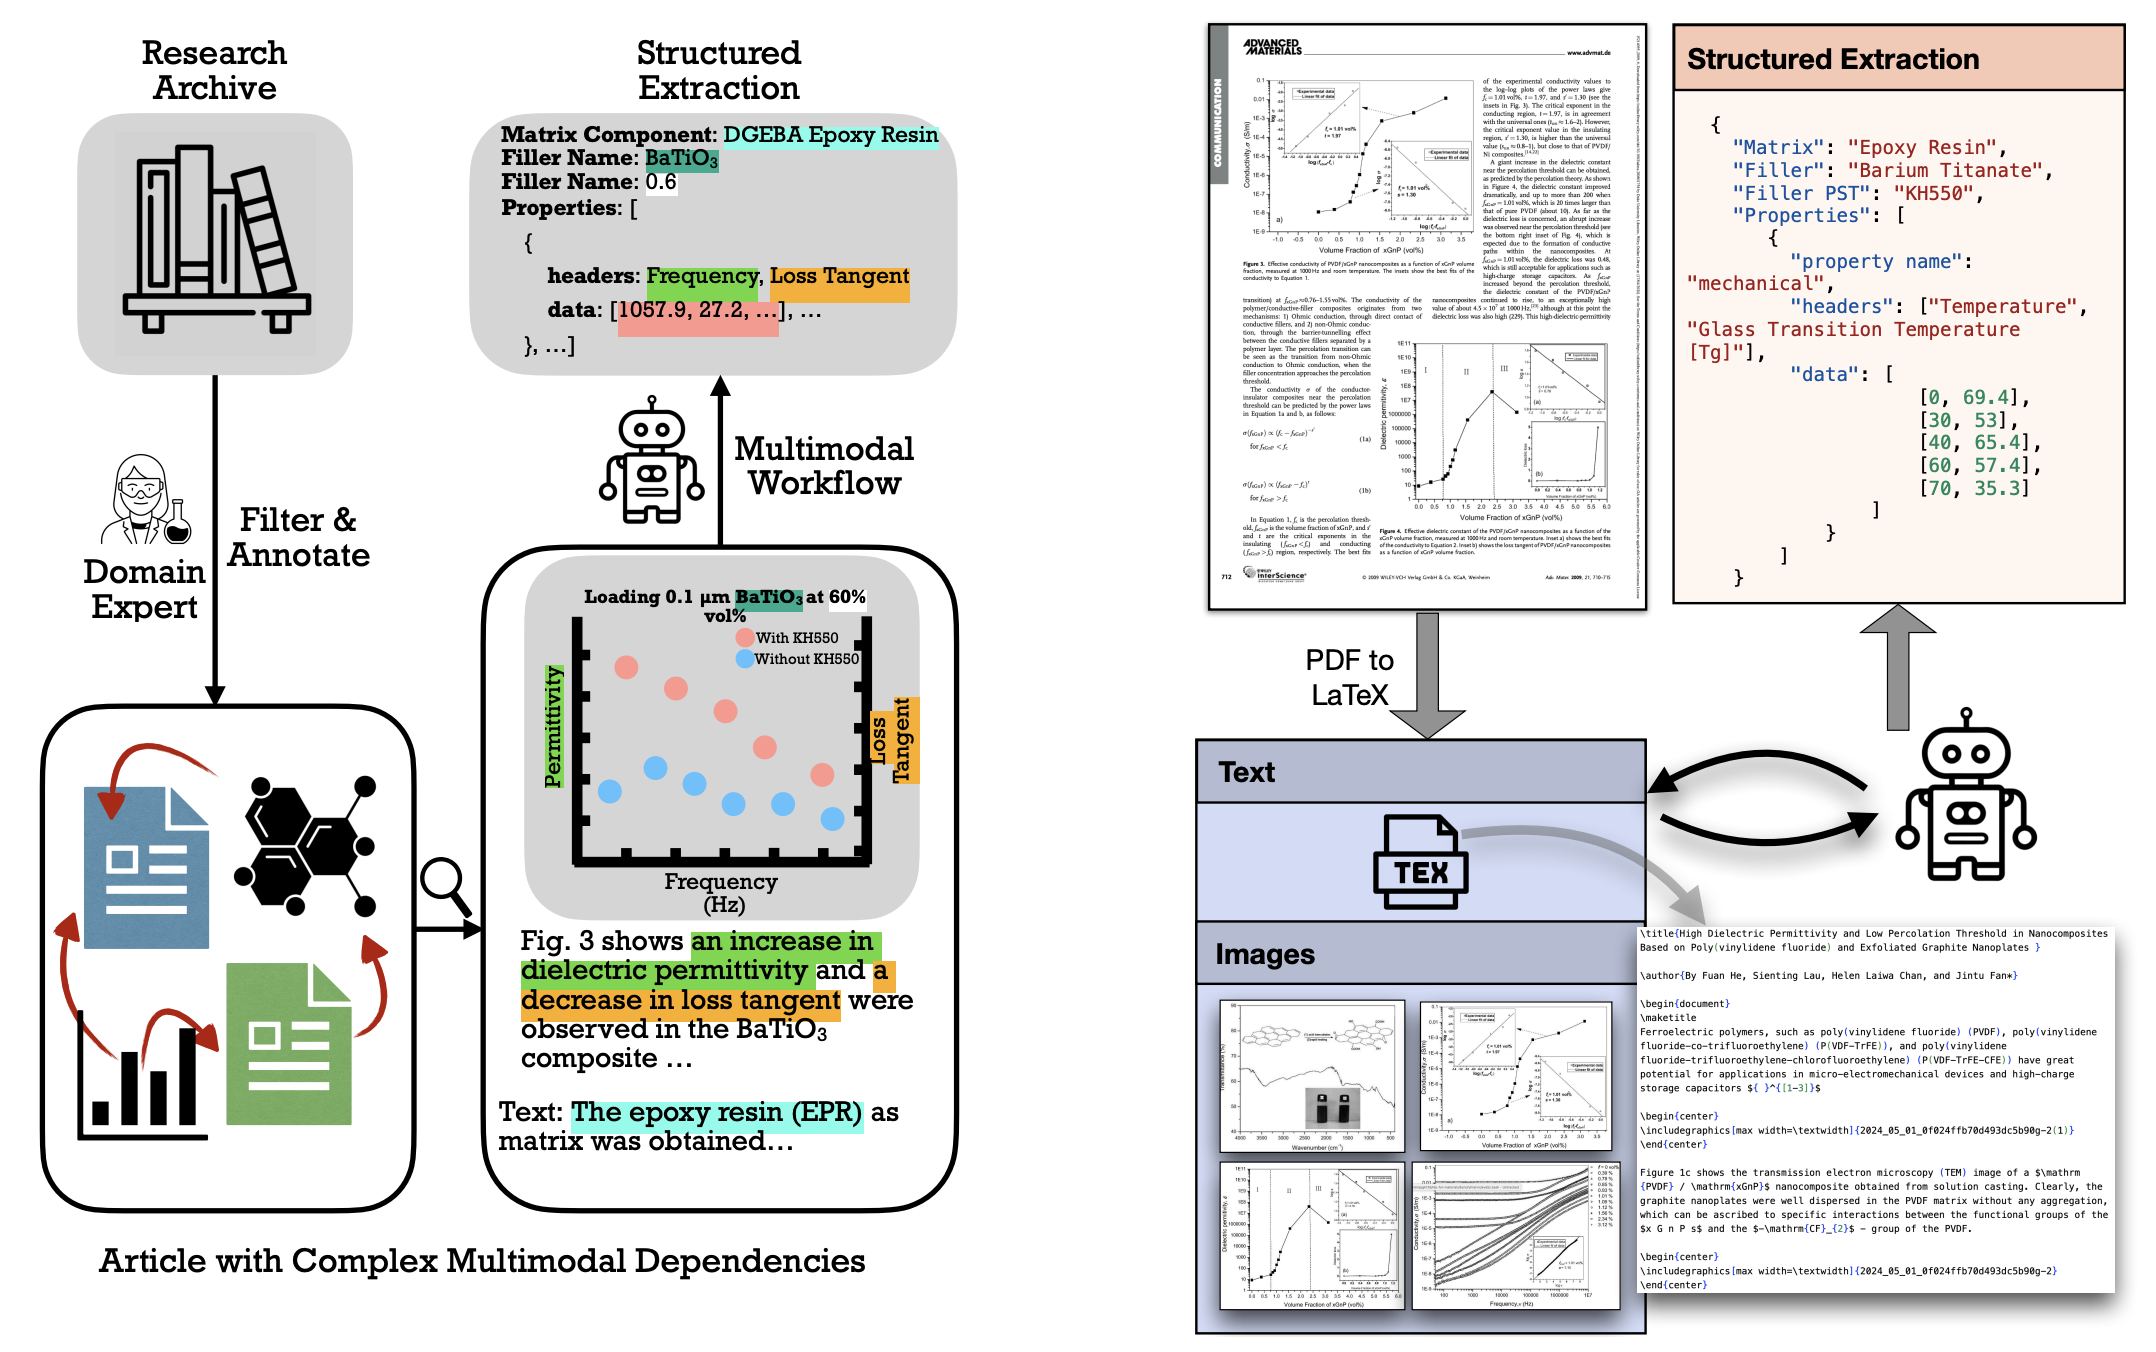

Multimodal information extraction (MIE) is crucial for scientific literature, where valuable data is often spread across text, figures, and tables. In materials science, extracting structured information from research articles can accelerate the discovery of new materials. However, the multimodal nature and complex interconnections of scientific content present challenges for traditional text-based methods. We introduce MatViX, a benchmark consisting of 324 full-length research articles and 1,688 complex structured JSON files, curated by experts in polymer nanocomposites and biodegradation. These JSON files are extracted from text, tables, and figures, providing a comprehensive challenge for MIE. Our results demonstrate significant room for improvement in current models.
These articles contain interconnected data, including material compositions represented as strings and properties represented as curves—lists of data points that capture material behavior. Extracting this information in a structured format is essential to train machine learning models for advancing materials discovery.
We focus on two domains of materials articles: Polymer Nanocomposites and Polymer Biodegradation. Each domain uses a distinct JSON template, but generally, the JSON files consist of material compositions (various aspects of them) and properties (descriptions of how these compositions behave as reported in the articles). Compositions are represented as simple strings, while properties are lists of (x, y) data points.
For example, in a polymer nanocomposite, the matrix might be diglycidyl ether of bisphenol A (one aspect of the composition), with the filler as barium titanate. This composition has properties like electrical, rheological, and mechanical characteristics. In one case, at a frequency of 1000, this composition has a loss tangent of 0.022, representing an electrical property. If you want to see the full JSON of this sample, click here.
The evaluation consists of two main steps: first, verifying if the models correctly identify the compositions of materials within each sample, and then checking if they accurately extract the properties for each matched composition.
For composition alignment, we use an F1 Score to evaluate how well predicted and ground truth compositions match. For property evaluation, we use two metrics—the Curve Similarity Score (CSS) and the Curve Alignment Score (CAS)—to assess the accuracy of the extracted curves representing properties. CSS measures the similarity of each property’s curve between predictions and ground truth, while CAS evaluates how accurately multiple curves are matched within each sample.

Evaluation results for predicting Compositions (P: Precision, R: Recall, F1: F1-Score) and Properties (Headers, Curves, CAS) under different configurations (Base: Baseline, T-Only: Text Only, T+Img: Text + Image). The highlighted values indicate the highest scores among the models. (green) indicates the increase in performance when using DePlot compared to its non-DePlot counterpart in the same configuration.
DePlot (Liu et al., 2023) converts visual plots into structured data. We observe that integrating DePlot improves property extraction accuracy.
@misc{khalighinejad2024matvixmultimodalinformationextraction,
  title={MatViX: Multimodal Information Extraction from Visually Rich Articles},
  author={Ghazal Khalighinejad and Sharon Scott and Ollie Liu and Kelly L. Anderson and Rickard Stureborg and Aman Tyagi and Bhuwan Dhingra},
  year={2024},
  eprint={2410.20494},
  archivePrefix={arXiv},
  primaryClass={cs.CL},
  url={https://arxiv.org/abs/2410.20494},
}